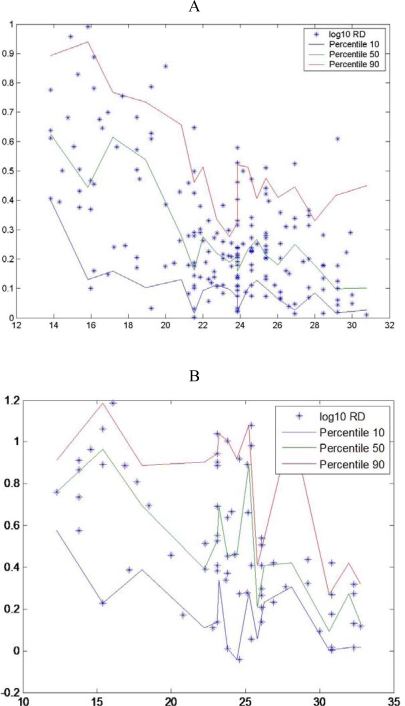
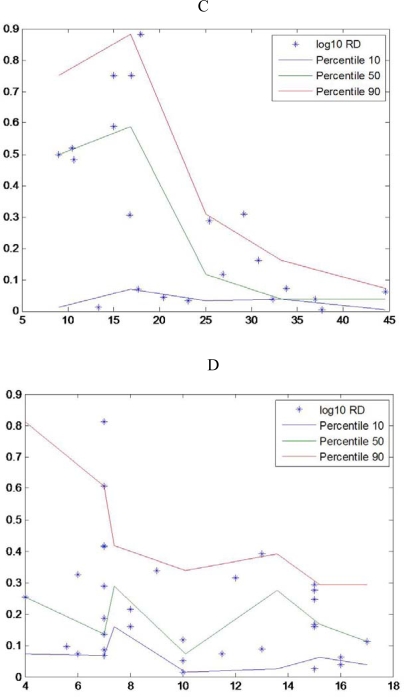
Figure 3.
Observed nucleic acid ratio (y-RNA:DNA, log-transformed) in relation to standard larval (x) length (*) with the estimated 10th, 50th and 90th percentiles (thin solid lines) for A- Sardina pilchardus larvae, B- Engraulis encrasicolus, C-Atherina presbyter larvae and D- Pomatoschistus spp larvae (data from [46]).


