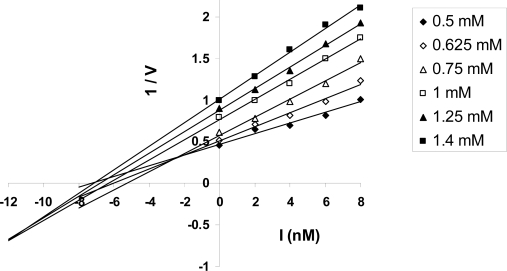
Figure 4.
Dixon Plot of inverse of the rate of ATP synthesis measured in μmol ATP (mg chlorophyll)−1 min−1 (1/V) against anion channel inhibitor DIDS concentration (I) measured in nM for ATP synthesis by spinach thylakoids. Inhibiton was studied with HCl and DIDS concentrations ranging from 0.5 mM to 1.4 mM and 0 nM to 8 nM respectively. The HCl concentrations employed were: 0.5 mM (♦); 0.625 mM (⋄); 0.75 mM (▵); 1.0 mM (□); 1.25 mM (▴); 1.4 mM (▪).

