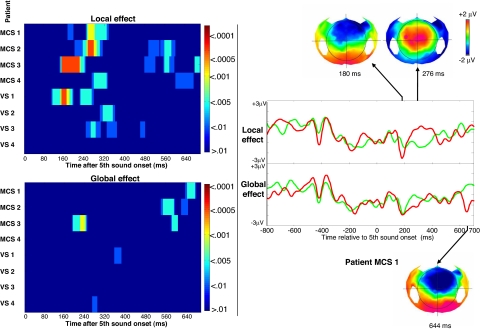
Fig. 5.
Local and global effects in noncommunicating patients. Individual statistics are plotted for the 8 noncommunicating patients VS or MCS patients. (Left) Each horizontal line summarizes an individual subject statistics. (Right) Averaged high-density ERPs of the local (top) and global (bottom) effects of patient MCS 1. Voltage scalp topographies are shown for the MMN ≈200 ms (top left), for the local effect vertex-positivity ≈300 ms (top right), and for the global effect (bottom).

