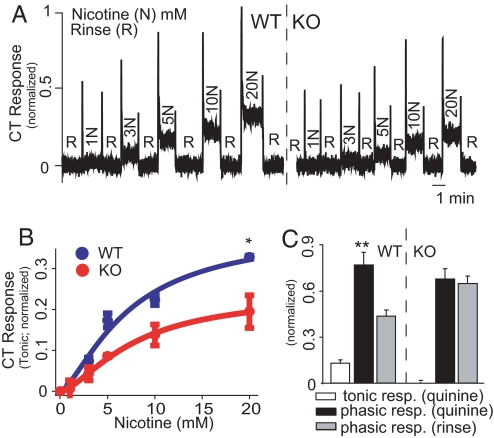
Fig. 2.
Chorda Tympani (CT) responses to nicotine and quinine in mice. (A) Phasic and tonic CT responses to nicotine (N) were of lower magnitude in a KO (right trace) than in a WT (left trace) mouse. In all CT recordings, water was applied between stimuli as rinse solution (R) and responses were normalized to the mean tonic response obtained with 300 mM NH4Cl. (B) Tonic responses to nicotine were compared in 3 WT (blue curve, n = 1.44, EC50 = 7.2 mM, R2 = 0.96) and 3 KO (red curve, n = 1.5, EC50 = 7.8 mM, R2 = 0.99) mice. Significant differences were found for genotype (P < 0.002), nicotine concentration and their interaction (P < 0.0001 for both, 2-way repeated measures ANOVA). Genotype-dependent differences were significant at 20 mM (*, P < 0.05; Bonferroni). (C) Tonic responses to 10 mM quinine were observed in 3 WT mice (Left) but not in 3 KO mice (Right). In KO mice, phasic responses were not different from those obtained with rinse (P > 0.3), whereas, in WT mice, they were significantly higher (**, P < 0.002; paired 2-sample t test).

