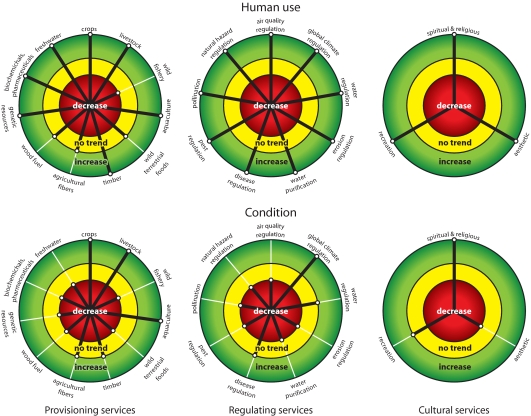
Fig. 1.
Trends in human use (Upper) and condition (Lower) of ecosystem services. Provisioning, regulating, or cultural ecosystem services are shown in Left, Center, and Right, respectively. Length of black radial lines shows the degree of change in human use or condition of the service. Modified from data in Table C.1 of ref. 12.

