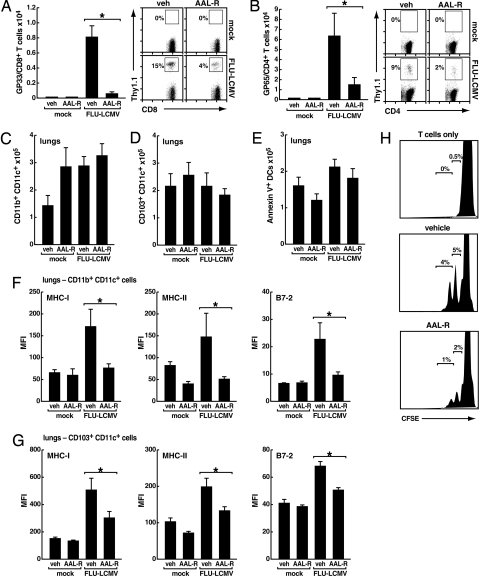
Fig. 4.
Sphingosine analog AAL-R inhibits both induction of influenza virus-specific T cells in MLN and activation of DC in the lung. (A) Number (left) and percentage (right) of Thy1.1+ TCR transgenic GP33/CD8+ T cells in MLN 5 dpi with mock or FLU-LCMV and i.t. administration of VEH or AAL-R (0.3 mg/kg) 1 hpi. Representative of two different experiments, both showed similar results, n = 3–4 mice per group, mean ± SEM; * P < 0.05. (B) Number (left) and percentage (right) of Thy1.1+ TCR transgenic GP65/CD4+ T cells in MLN 6 dpi with mock or FLU-LCMV and i.t. instillation with VEH or AAL-R (0.1 mg/kg) 1 hpi. n = 4 mice per group, mean ± SEM; * P = 0.07. Number of (C) CD11c+CD11b+CD103- cells and (D) CD11c+CD11b-CD103+ cells in the lungs at 2 dpi with mock or FLU-LCMV and i.t. treatment with VEH or 0.1 mg/kg AAL-R 1 hpi. (E) Number of annexin-V+ CD11c+cells in lungs 12 h after infection with mock or FLU-LCMV, and i.t. treatment with VEH or 0.1 mg/kg AAL-R 1 hpi. Representative of two different experiments, all showed similar results, n = 4 mice per group; * P < 0.05. (F and G) Mean fluorescence intensity (MFI) of MHC-I (H-2Kb), MHC-II (I-Ab) and B7–2 on (F) CD11b+ DC and (G) CD103+ DC was analyzed. Cells were isolated from lungs 2 dpi with FLU-LCMV and i.t. treatment with VEH or AAL-R (0.1 mg/kg) 1 hpi. n = 4 mice per group; mean ± SEM. *, P < 0.05. (H) Proliferation of T cells cultured alone (top); with DC from FLU-LCMV + VEH treated mice (center); with DC from FLU-LCMV + AAL-R-treated mice (bottom). See SI Materials and Methods for details. Representative of 3 different experiments, all showed similar results.

