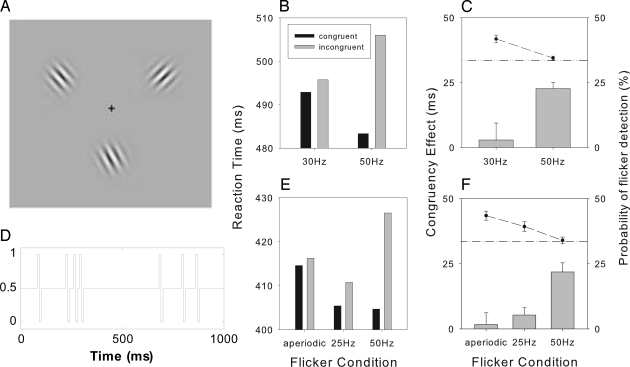
Fig. 1.
Stimuli and results of first two experiments. (A) Example of a stimulus display. Two groups of 20 observers each were tested at each of the two modulation frequencies (50/30 Hz). Each group was tested on two tasks: (i) detection of a change-target after the flicker interval, and (ii) detection of the flicker (without any additional change-target), in separate blocks (see Materials and Methods). (B) Reaction times on congruent and incongruent trials. (C) Congruency effect (Left, bar) and flicker detection rate (Right, symbols and line). The horizontal dotted/dashed line corresponds to the chance level (33%) of flicker detection. A second comparison of the 50-Hz modulation with (i) a 25-Hz flicker and (ii) an aperiodic temporal modulation was made by using a within-participant design (with trials, corresponding to 25/50-Hz or aperiodic modulations, randomized within each block). (D) Example waveform showing the contrast modulation of the cue, over a 1-s interval, in the aperiodic condition. (E) RTs. (F) Corresponding congruency effects and detection rates. Error bars (in this and subsequent figures) denote 1 SE (standard error), and where applicable the SE has been adjusted for within-subject designs (21).

