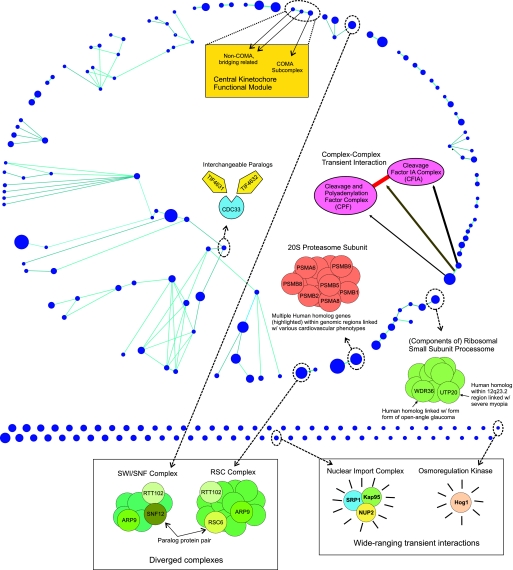
Fig. 1.
S. cerevisiae interactome. Blue nodes represent 210 predicted multiprotein complexes and 38 kinases (node sizes proportional to complex sizes). Light blue represent 113 putative predicted restricted transient interactions between nodes (65 complex–complex predicted interactions and 48 kinase–substrate literature-based interactions). The network is laid out in Polar Map fashion (47, 48), with each topological module placed in a conical region with some blank space in between the modules. A diversity of biological issues and cases discussed throughout the main text are highlighted.

