Fig. 1.
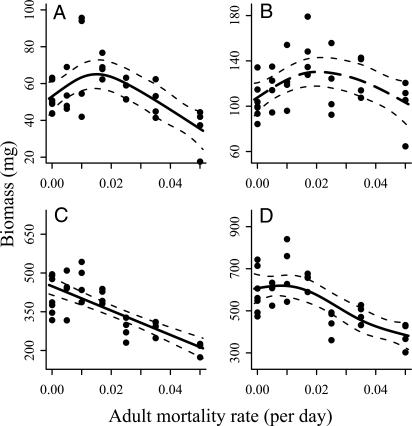
Biomass of different size classes as a function of adult mortality: (A) juvenile biomass, (B) nonrecruit biomass, (C) adult biomass, and (D) total biomass. Each dot represents the estimated long-term average biomass of a replicate (n = 31). Solid lines represent the fitted and selected models (see Table 2). The regression was only marginally significant for nonrecruits, as indicated by the long-dashed line. The thin-dashed lines give the approximate 95% CIs. Note that the ordinate axes differ between panels and do not include 0.

