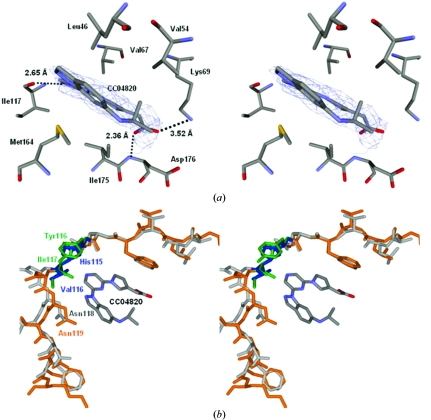
Figure 4.
Stereoview of the ATP-binding region. (a) Illustration with the inhibitor. Hydrogen bonds are shown as dotted lines. The N atoms are shown in blue and the O atoms are shown in red. (b) Superposition of the hinge region of hCK2α2 (orange) on that of hCK2α1 (grey). The different residues in the hinge region are highlighted for hCK2α2 (green) and hCK2α1 (blue).

