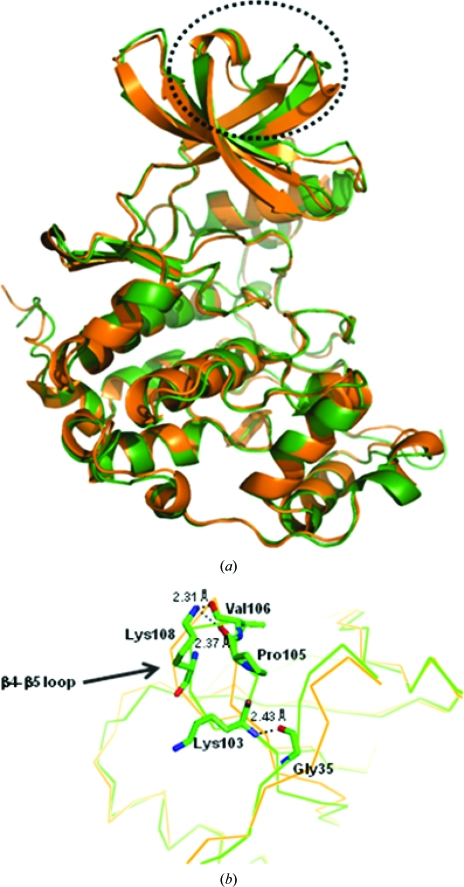
Figure 5.
Superposition of the Cα traces of hCK2α2 (green) and hCK2α1 (orange; PDB file 1pjk). (a) The largest structural difference is indicated by the dotted circle. (b) A close-up of the interaction is shown from the hydrogen bonds between the N-terminal region and the β4 and β5 loop responsible for α/β association. The N atoms are shown in blue and the O atoms in red.

