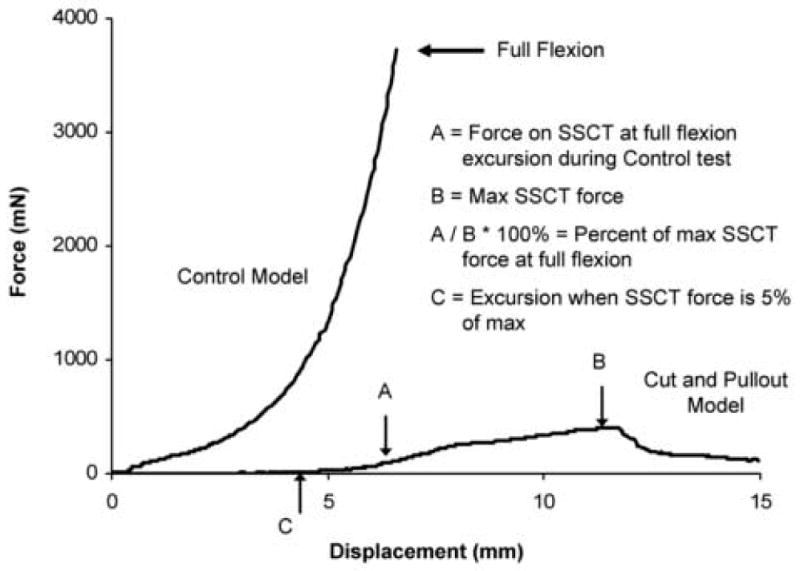
Figure 2.

Typical force-excursion curves for Control and Cut and Pullout Models. Point A is the force on the SSCT at full flexion excursion during the Control test. Point B is the maximum SSCT force. A/B*100% is the percent of maximum SSCT force at full flexion. Point C is the excursion when SSCT force is 5% of the maximum.
