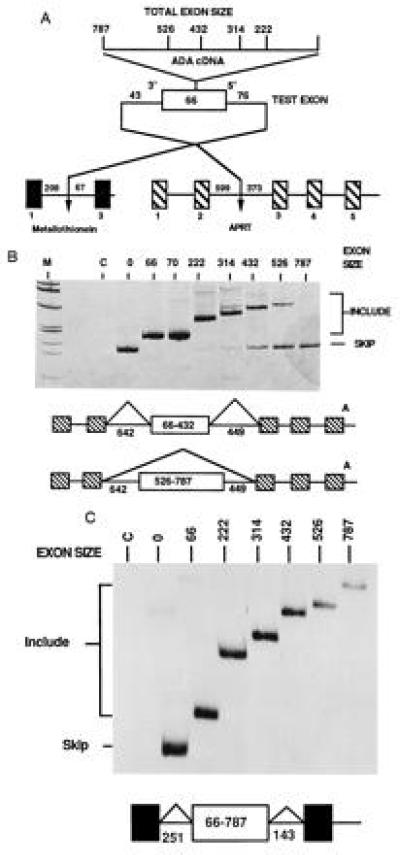
Figure 1.

Large internal exons have different splicing phenotypes when placed in different genes. (A) Structure of the genes used to test exon size limits. Exon expansion cassettes derived from cDNAs were used to expand the natural second exon of mouse MT II which was then placed into test genes. (B) In vivo splicing phenotypes of expanded exons containing an expansion cassette from ADA cDNA within the CHO APRT gene. The hatched exons are from the resident APRT gene, the white exon is the expanded exon 2 from MT. Splicing phenotypes were determined by RT-PCR analysis of total cell RNA. To emphasize visualization of RNAs resulting from exon inclusion, the amplification products were detected by silver staining; therefore, an equal intensity of skipping to inclusion products with exons of 400–800 nt represents a strong bias toward skipping. Lanes C and 0 indicate amplification of RNA from nontransfected cells and the parental APRT gene, respectively. (C) In vivo splicing phenotypes of the same expanded exons tested within the MT gene. The gel shown is an autoradiogram of an amplification reaction using labeled PCR primers. The results shown are from transfection of CHO cells; a similar result was observed when the recipient cells were NIH 3T3 cells.
