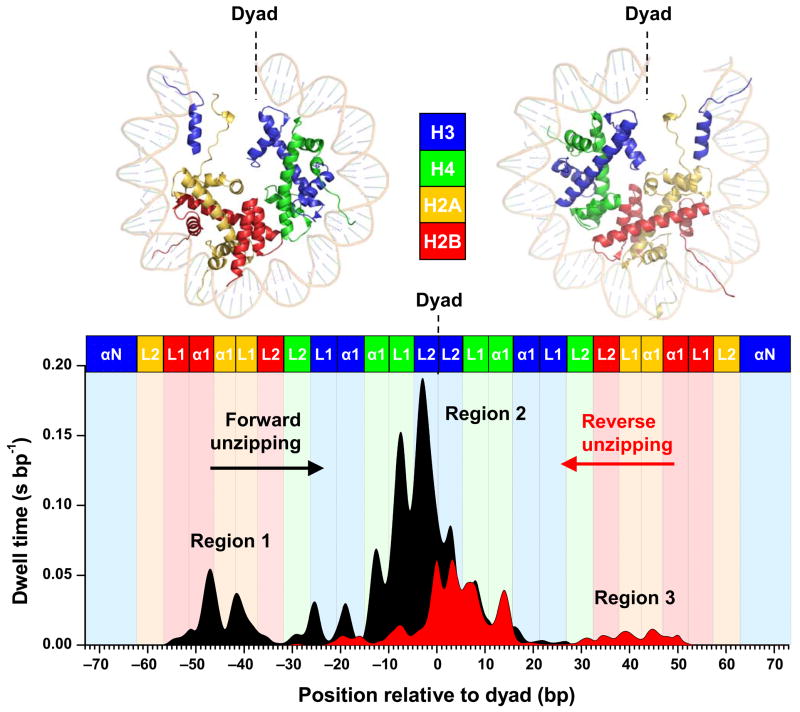
Figure 2.
Histone-DNA interaction map within a nucleosome core particle. Top Panel: Crystal structure of the nucleosome core particle1, where dots indicate regions where interactions between DNA and one of the core histones are likely to occur. The two halves of the nucleosome are shown separately for clarity. Bottom Panel: A histone-DNA interaction map constructed from the averaged dwell time histograms of the unzipping fork at constant force (~ 28 pN). Individual traces were low-pass filtered to 60 Hz and their dwell time histograms were binned to 1 bp. A total of 27 traces from the forward template and 30 traces from the reverse template were used for the construction. Each peak corresponds to an individual histone-DNA interaction and the heights are indicative of their relative strengths. Three regions of strong interactions are indicated: one located at the dyad (region 2) and two located off-dyad (regions 1 and 3). Colored boxes indicate predictions from the crystal structure where individual histone binding motifs are expected to interact with DNA. The H3 N-terminal alpha helices (αN) and the histone loops (L1, L2) and alpha helices (α1) that compose the L1L2 and α1α1 DNA-binding sites observed in the crystal structure1 are also indicated.

