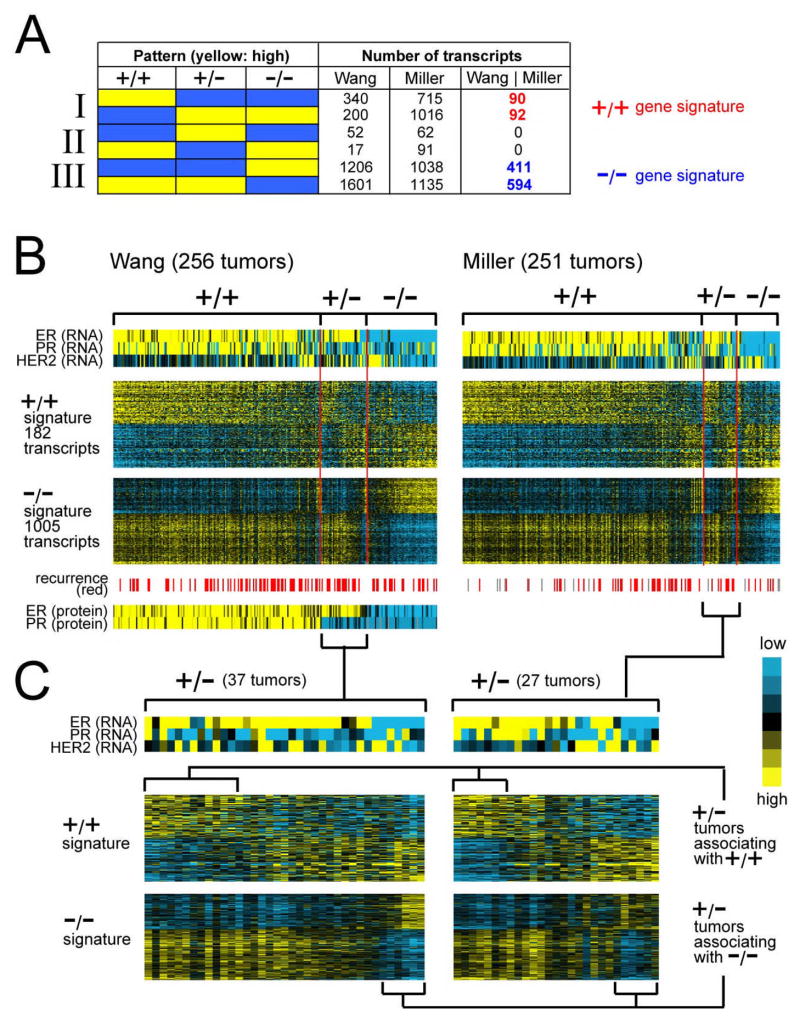
Figure 1.
Global gene expression patterns associated with ER+/PR+ (“+/+”), ER+/PR− (“+/−“), and ER−/PR− (“−/−“) clinical assay-assigned human breast tumors. (A) Number of RNA transcripts found over- or under-expressed specifically in one of the three breast tumor subtypes in each of the Wang and Miller expression profile datasets, as well as the number of subtype-specific transcripts common to both datasets (“Wang | Miller”). +/+ gene signature, genes/transcripts expressed specifically in ER+/PR+ compared to both ER+/PR− and ER−/PR− tumors (p < 0.01 each comparison in Wang dataset, p < 0.05 each comparison in Miller dataset). −/− gene signature, genes expressed specifically in ER−/PR− compared to both ER+/PR+ and ER+/PR− tumors. (B) Heat map representation of expression patterns of the ER+/PR+ and ER−/PR− gene signatures in the Wang and Miller profile datasets. Rows of the map represent genes; columns, profiled tumors. Relative expression is represented as colorgram (yellow: high expression). Expression values centered on the mean of the clinical group centroids. RNA expression patterns for genes ER, PR, and HER2 corresponding to the tumors are also indicated, as well as protein expression of ER and PR in the Wang dataset (protein data not available for Miller dataset), and recurrence events (gray: missing data). (C) Heat map representation of ER+/PR+ and ER−/PR− gene signatures in ER+/PR− tumors only (expanded from part B). Profiles were manually sorted to highlight those similar to ER+/PR+ and those similar to ER−/PR− tumors.

