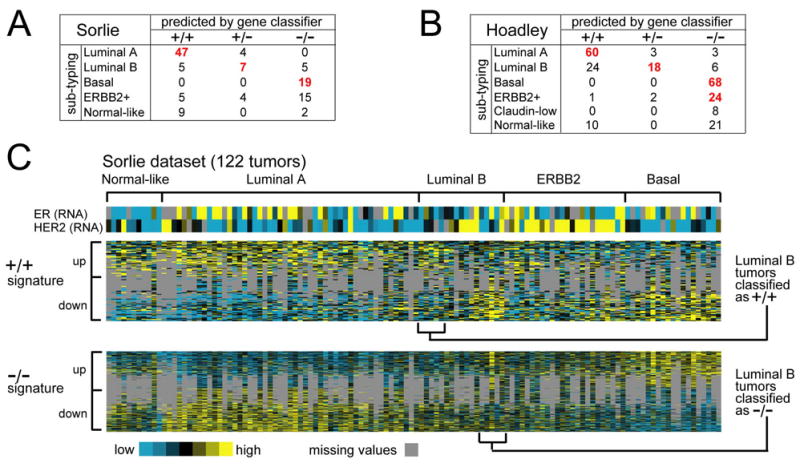
Figure 3.

ER+/PR− tumors as defined by gene signatures associate with the luminal B breast cancer molecular subtype. (A) Confusion matrix for the tumor profile dataset from Sorlie et al. [25], comparing subtype assignments using the ER+/PR+ and ER−/PR− gene signatures with the molecular profile subtypes as defined previously by unsupervised analysis. Red bold denotes a significant number of subtype assignments by the gene classifier of Fig. 2a within one of the Sorlie molecular subtypes (P < 0.001, one-sided Fisher’s exact). (B) Confusion matrix for the profile dataset from Hoadley et al. [36]. (C) Heat map of the ER+/PR+ and ER−/PR− gene signatures (100 and 570 genes represented, respectively) in the Sorlie tumor profile dataset (gray: missing data values)
