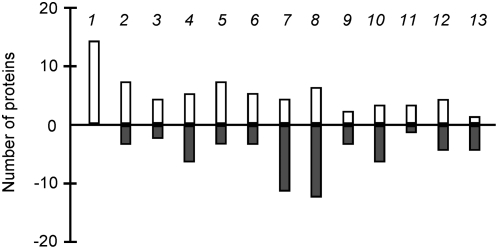
Figure 4. Functional profiling of up- and downregulated proteins in the IrrE-expressing E. coli strain compared with the control strain.
The functional role category annotation is that provided by BioCyc (http://biocyc.org/). Each column represents the number of proteins with at least twofold changes in a selected functional category. Positive and negative values indicate up- and down-regulation, respectively. Columns: 1, nucleotide biosynthesis; 2, amino acid biosynthesis; 3, biosynthesis of cofactors, small molecule carriers; 4, RNA synthesis, modification, DNA transcription; 5, proteins (translation and modification); 6, proteins (chaperones); 7, energy metabolism; 8, carbon utilization; 9, central intermediary metabolism; 10, transport and binding proteins; 11, cytoskeleton; 12, cellular processes and 13, hypothetical proteins.

