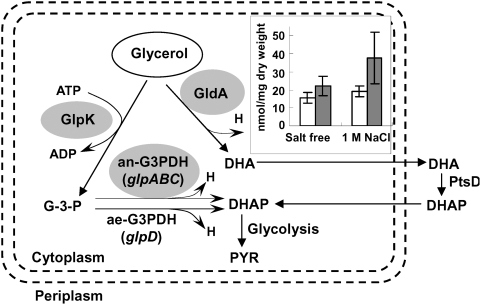
Figure 5. Schematic representation of the E. coli glycerol dissimilation pathways and the change in intracellular glycerol content.
Expression levels of the major enzymes were found to be decreased by at least 2-fold (grey shading), as indicated by proteomics analysis. Inset shows the change in intracellular glycerol content in an IrrE-expressing strain (▪) and a control strain (□) after incubation for 1 h with or without 1.0 M NaCl. Data represent the means and standard errors of three replicate experiments in which each sample was assayed in duplicate. Statistical significance was determined by Student's t test (n = 6, P<0.05). Abbreviations: GlpK, ATP-dependent glycerol kinase; GldA, Glycerol dehydrognease; ae-G3PDH, aerobic G3PDH; an-G3PDH, anaerobic G3PDH; PtsD, DHA-specific enzyme II; H, reducing equivalents (H = NADH/NADPH); GPD, glycerophosphoryl diester; DHA, dihydroxyacetone; DHAP, dihydroxyacetone phosphate; PYR, pyruvate.

