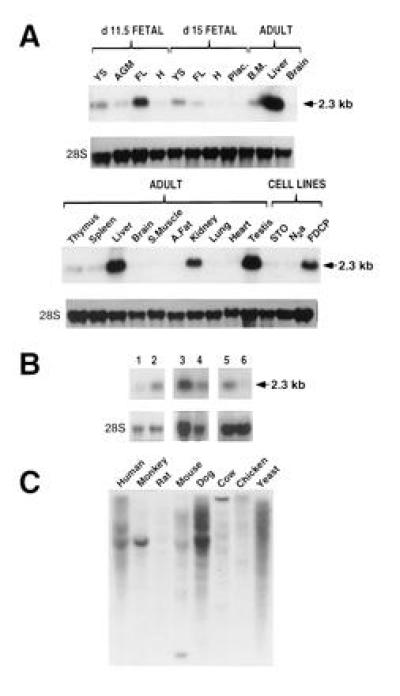
Figure 2.

Northern blot and species distribution analyses of Sps2. (A) Sps2 is preferentially expressed in tissues where known selenoproteins are produced and in sites of blood cell development. YS, yolk sac; AGM, AGM region (see text); FL, fetal liver; H, head of the embryo; Plac, placenta; BM, bone marrow; S.Muscle, skeletal muscle; A.Fat, perivisceral abdominal fat; FDCP, hematopoietic FDCPmixA4 cell line; STO, fibroblast cell line STO (15); N2a, neuronal cell line N2a (15); 28S, ribosomal RNA. (B) Sps2 is a T-cell activation gene. Lanes: 1, unstimulated CD4+ CD8− T cells; 2, CD4+ CD8− T cells stimulated with anti-CD3; 3, unstimulated macrophages; 4, macrophages stimulated with lipopolysaccharide; 5, serum-deprived fibroblasts; 6, serum-stimulated fibroblasts. (C) SPS is highly conserved among a variety of animal organisms as shown by probing a Zooblot with the 5′ untranslated region (UTR) of mouse Sps2.
