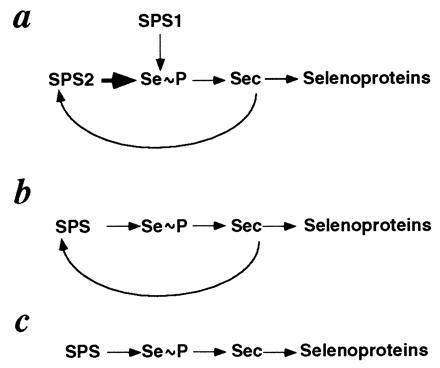
Figure 5.

Simplified diagram to represent the three available scenarios in Sec metabolism: (a) Mus musculus and Homo sapiens (Eukaryotes). (b) H. influenzae (Bacteria) and M. jannaschii (Archaea). (c) E. coli (Bacteria). The wider arrow in SPS2 denotes the likely difference in activity, yet to be demonstrated (1), between this enzyme and SPS1.
