
Figure 3.
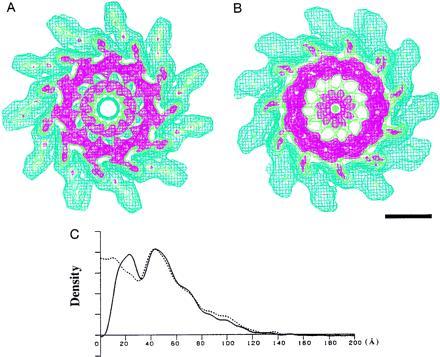
Wire frame representation of the density map of the filaments showing higher contour levels and their radial density distributions. (A) SJW1655. (B) F-(1–486) of SJW1103. Both maps are axial views of 50-Å-thick cross sections. Color coding of contour lines indicates density levels of 1.0, blue; 1.8, green; 2.1, red. The contour lines in blue approximately cover the correct molecular volume. (Bar = 50 Å). In A, the contour lines in red show a concentric double-tubular structure in the core of the filament, which is a common feature of all the intact filaments of supercoiled, the L- and R-type straight forms. In B, the density corresponding to the inner tube moved toward the axis, while the other part remained unchanged. (C) Radial density distributions of the filaments of intact and truncated flagellins. The solid line represents the density distribution of SJW1655, and the dotted line represents that of F-(1–486) of SJW1103.