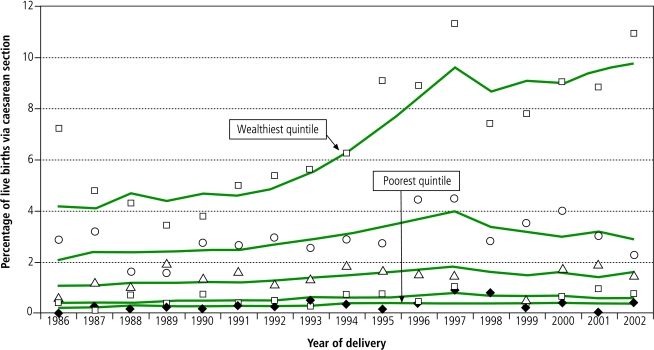
Fig. 4.
Trends in ratesa of caesarean section in Indonesia 1986–2002, by wealth quintile
a Predicted rates were calculated from adjusted logistic regression model and overlaid on observed rates, by quintile and year.
Source: Demographic and Health Surveys, Indonesia, Reference 15.

