
Figure 2.
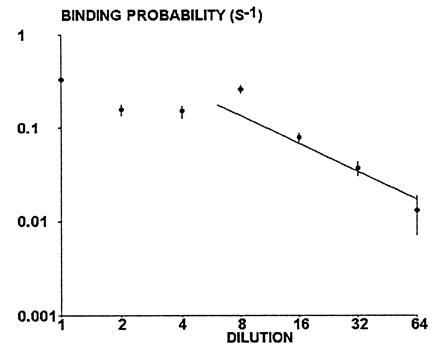
Dependence of binding probability on binding site density. Beads were coated with various densities of CD48 sites and driven along CD2-derivatized surfaces with a wall shear rate of 22 s−1. The binding probability was calculated as the mean number of detectable arrests per second of observation. Each point represents between 32 and 115 arrests, determined on hundreds of beads for each concentration. Each vertical bar represents twice the theoretical standard error calculated as explained. The straight line is a regression line determined on the five highest dilutions. The slope is 0.989 and the correlation coefficient is 0.919.