
Figure 5.
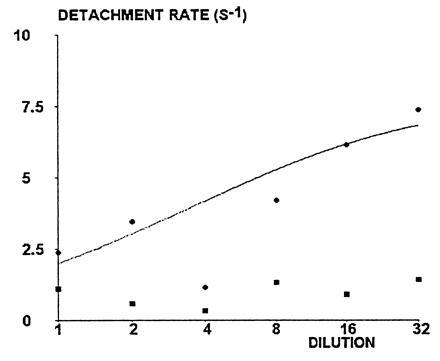
Effect of site dilution on detachment rate. Wall shear rate was 22 s−1. Circles represent the initial detachment rate. The solid line represents a theoretical plot of detachment rate versus dilution. The theoretical detachment rate was defined as the first decay constant of binding probability [i.e., as shown in Eq. 7, (r + 3 - δ)k−/2]; this was calculated assuming that k− was independent of dilution, whereas k+ was inversely proportional to the dilution factor. Fitted values of unknown parameters were k+ = 39.6 s−1 and k− = 7.8 s−1. Squares represent the mean detachment rate between 0.5 and 1 s after arrest.