Figure 3.
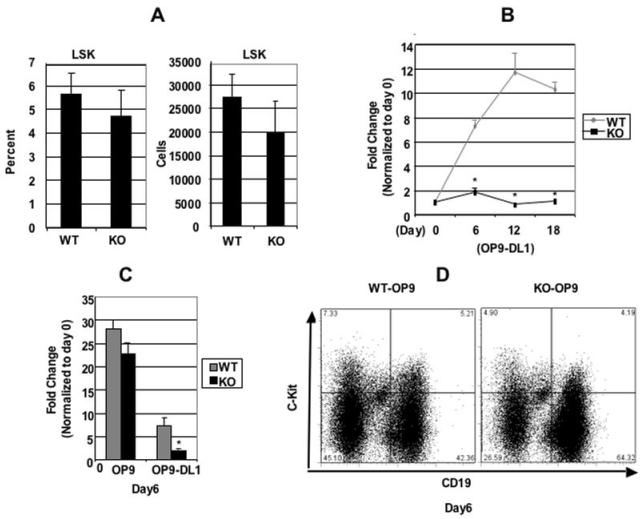
CDK6 is required for Notch-dependent proliferation. A, Bone marrow (BM) cells obtained from WT and KO mice (from humerus and femur) were counted and stained with PE-conjugated antibodies specific for lineage (Lin) markers (CD3, CD4, CD8, B220, Mac-1, Gr-1, TER119) and SCA-1-Fitc, c-KIT-APC. Labeled cells were subsequently analyzed by FACS. The percentage of Lin-Sca-1+c-Kit+ (LSK) population (on the left) was expressed as mean ± S.E (n=4 for WT and KO). The absolute cell numbers (×106) for the LSK (On the right) were calculated based on the total number of cells and the percentage of LSK in the total cell population and are shown as bar diagrams. The cell numbers are expressed as mean ± S.E. N=4 for WT and KO. B, c-Kit+Lin- bone marrow cells were cocultured on OP9-DL1 cells and counted at times indicated. The expansion fold change was calculated based on the ratio between the total number counted at the time indicated versus the total c-Kit+Lin- cell number plated at day 0, which were arbitrarily defined as 1 unit. Data are expressed as mean ± S.E. *, p < 0.05, (N=5), significantly different from the control levels. C, c-Kit+Lin- bone marrow cells were cocultured on OP9 or OP9-DL1 cells and counted at day 6 indicated. The bar graph summarizes the fold changes over day 0 (which were arbitrarily defined as 1 unit) from separate (N=6) experiments. Data are expressed as mean ± S.E. *, p < 0.05, significantly different from the control levels which were arbitrarily defined as 1 unit. D, Representative example of FACS analysis for surface expression of CD19 and c-Kit of pre-B cells sorted from bone marrow and cultured for 6 days on OP9 cells.

