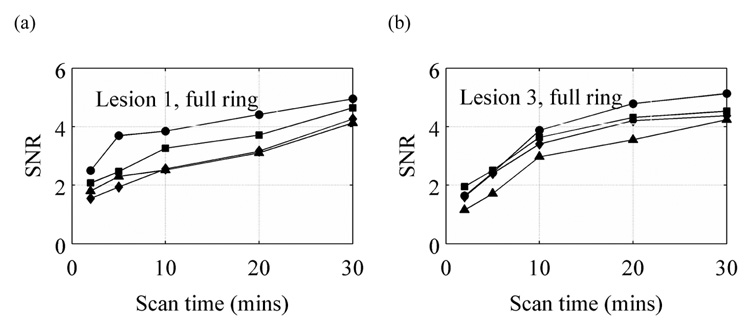
Figure 7.
SNR values for Lesions 1 (a) and 3 (b) in a 10-cm diameter phantom placed in full ring scanner with varying timing resolution. The curves with λ, ν, υ, and σ symbols are for 200ps TOF, 300ps TOF, 600ps TOF, and Non-TOF scanners, respectively. The crystal size for these simulations was 1×1×10-mm3.

