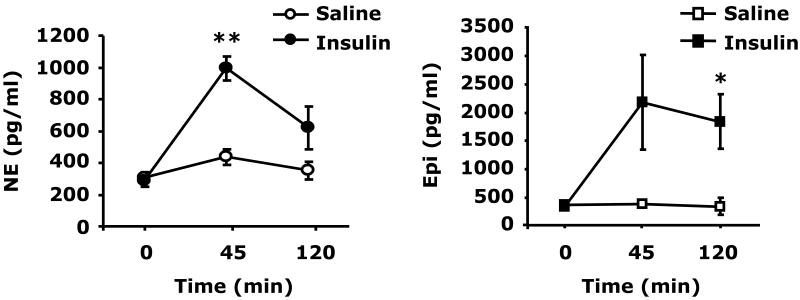
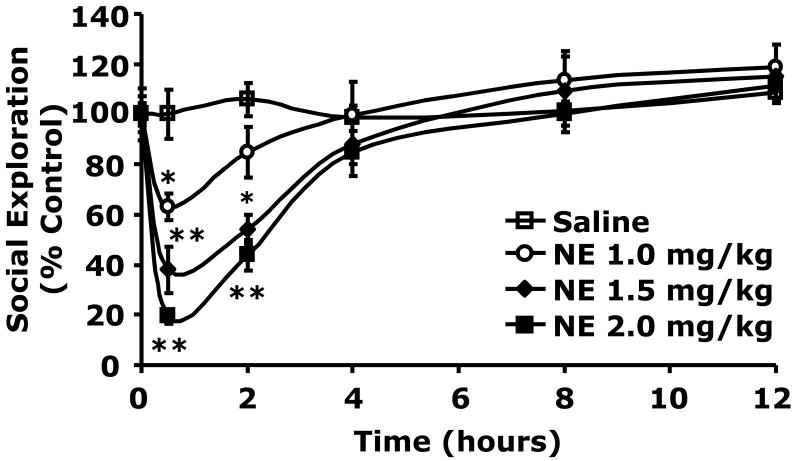
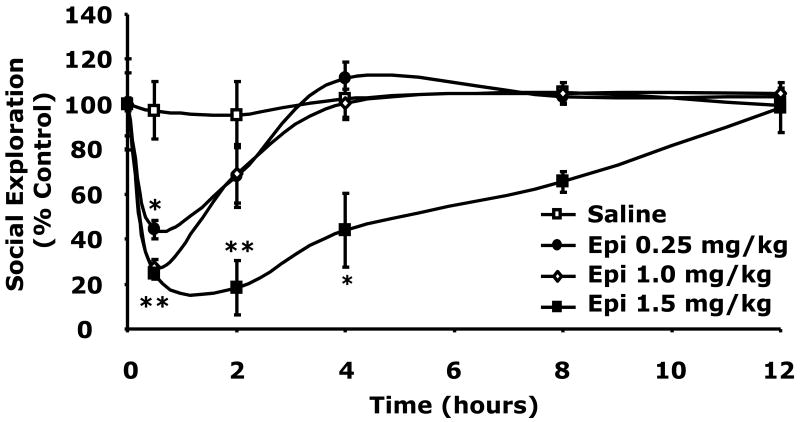
Fig.2. Catecholamines cause social withdrawal.
(A) After a 12 h fast, C57BL/6J mice were administered either insulin (Insulin) or saline control (Saline) at 0.8 units/kg insulin IP as indicated. Plasma catecholamines were measured by HPLC at 0, 45 and 120 min post insulin injection. Results are expressed as mean ± SEM; n = 3, *P <0.01, **P <0.001 Insulin vs. Saline. (B) Mice were administered NE (IP) at the concentrations indicated. Social exploration was measured at 0, 0.5, 2, 4, 8 and 12 h after NE delivery. Results are expressed as percentages of the baseline measurement, means ± SEM; n=4. *P<0.01, **P < 0.0001, NE vs. Saline. (C) Mice were administered Epi (IP) at the concentrations indicated. Social exploration was measured at 0, 0.5, 2, 4, 8 and 12 h after Epi delivery. Results are expressed as percentages of the baseline measurement, means ± SEM; n=4, *P<0.01, **P < 0.0001, Epi vs. Saline.


