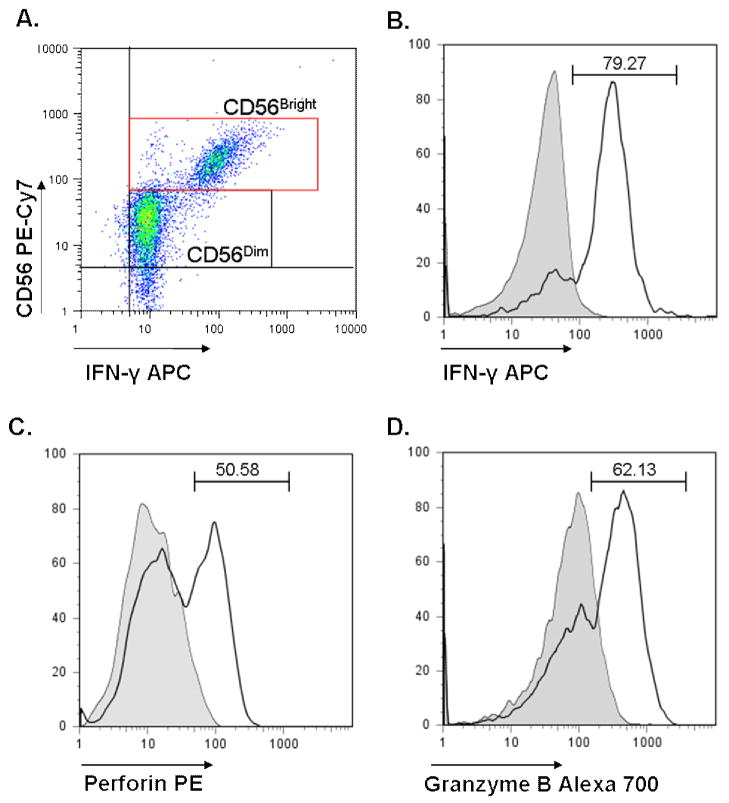
Figure 1. CD56Dim and CD56Bright subset determination.
A representative dot plot showing markers for CD56+ NK cell subsets (A). Following selection of CD3− CD8− cells, CD56Dim and CD56Bright cells can be identified by density of CD56 staining. A representative example of an ASD subject is shown for determination of frequency of IFNγ positive CD56Bright cells (B) and frequency of CD56Dim cells positive for perforin (C) and granzyme B (D). The shaded line denotes isotype control. The percentage of positive cells is denoted above each histogram.

