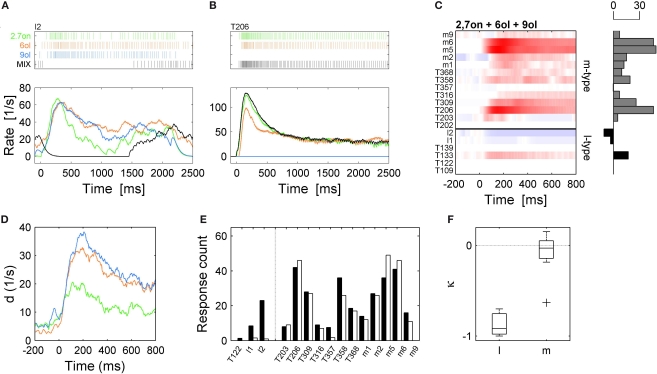
Figure 5.
Different mixture effects in l- and m-PNs. (A) Single trial spike trains (top) and rate responses (bottom) of an l-PN to three odor compounds (heptanon = green, hexanol = orange, nonanol = blue) are excitatory while the response to the mixture (black) of all three odors is inhibited. (B) An example of an m-PN that shows an excitatory response to the same mixture (black) which closely resembles the most salient response to the elemental mixture compound heptanon. (C) Color-coded rate responses of 6 l-PNs and 13 m-PNs (separated by the blue horizontal line) in response to the same tertiary mixture. The l-PNs show mostly no or inhibited responses while the m-PNs show clear excitatory responses as indicated by the horizontal count bars. (D) Dynamics of the distance d between the ensemble response to the mixture and the ensemble response to each of the mixture elements for 15 neurons that were tested for all four odors. (E) Comparison of the absolute count measured during an initial response interval of 500 ms in response to the strongest compound (black) and the response count for the mixture (white) for all neurons that were tested in all conditions. The l-PNs indicate inhibited responses to the mixture, while the m-PNs indicate strong excitatory responses to the mixture. (F) The index κ measures the relative difference of mixture response and most salient response to an individual compound for all l- and m-PNs that were tested in all conditions.

