
Fig. 2.
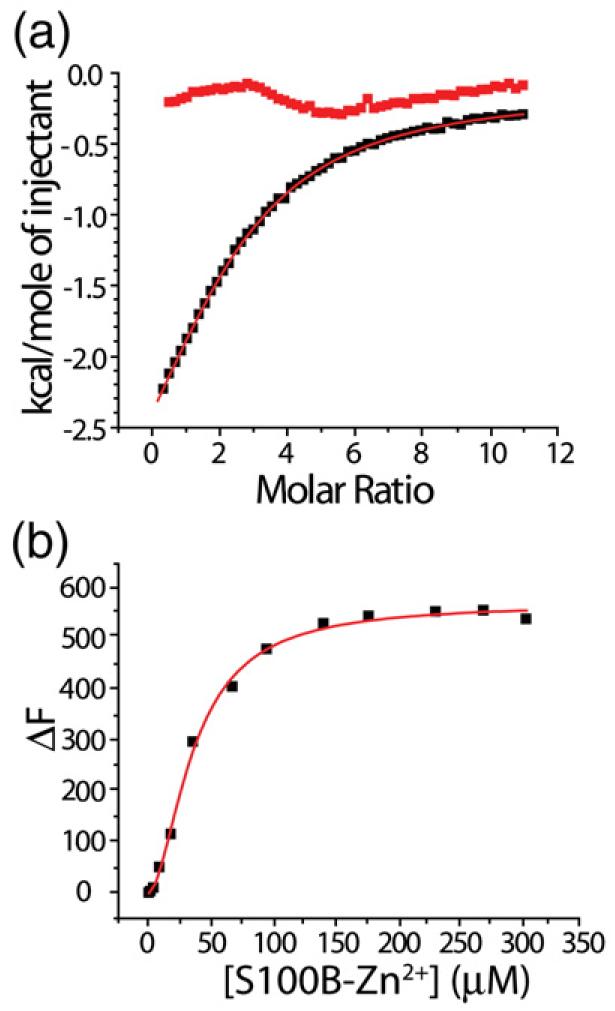
The binding of Pnt to Ca2+–S100B and Zn2+, Ca2+–S100B. (a) Representative ITC data illustrating the binding of Pnt to Ca2+–S100B (■; n=2). Conditions included 10 mM Tes, pH 7.2, 15 mM NaCl, and 10 mM CaCl2, at 37 °C. Shown also is a control experiment illustrating no Pnt binding to S100B in the absence of calcium (red boxes). (b) Representative titration of Zn2+–S100B (one Zn2+ ion per S100B subunit) with Ca2+ (10 mM) into a solution of Pnt and Ca2+ (10 mM) as monitored by changes in Pnt fluorescence (n=1.7). Conditions included 10 mM Tes, pH 7.2, 15 mM NaCl, 100 mM KCl, and 10 mM CaCl2, at 37 °C.