
Fig. 4.
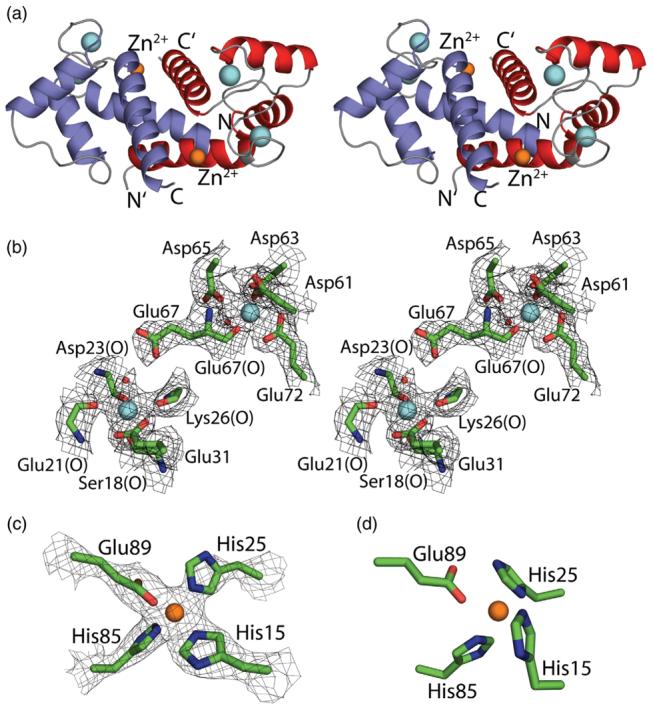
Calcium and zinc ion coordination in the X-ray structure of Zn2+,Ca2+–S100B. (a) X-ray crystal structure of Zn2+,Ca2+–S100B shown in stereo (walleye mode) as a ribbon diagram. The locations of two Ca2+ ions per subunit (cyan spheres) and one Zn2+ ion per subunit (orange spheres) are illustrated, and subunits of the symmetric S100B homodimer are colored red and blue, respectively. (b) Stereo view of the pseudo-EF-hand (Ser18, Glu21, Asp23, Lys26, and Glu31) and the canonical EF-hand (Asp61, Asp63, Asp65, Glu67, and Glu72) calcium-binding sites of S100B together with the 2mFo–DFc electron density map (1.0 σ). (c) Zn2+ coordination in Zn2+,Ca2+–S100B is illustrated together with the 2mFo–DFc electron density map (1.0 σ) defining the positions of His15′/His25′ from one subunit of S100B and His85/Glu89 from the other subunit. (d) Position of Zn2+ coordinating residues of Zn2+,Ca2+–S100B as predicted previously from the NMR solution structure and site-directed mutagenesis.7,8