
Fig. 5.
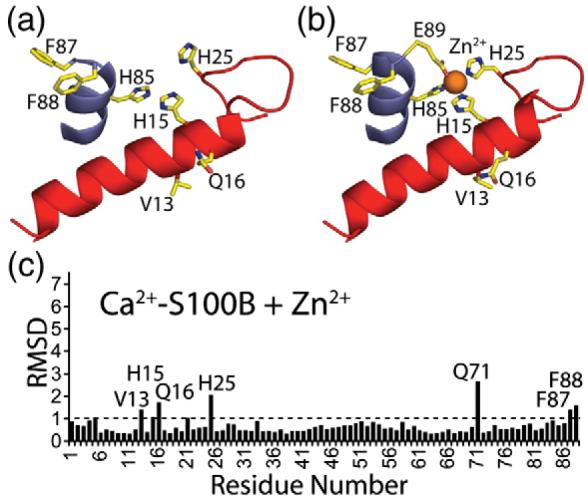
Changes in side-chain positioning upon the binding of Zn2+ to Ca2+–S100B. (a) Residues on helix 4 (blue) and helix 1′ (red) of Ca2+–S100B prior to binding Zn2+. (b) Residues on helix 4 (blue) and helix 1′ (red) of Zn2+,Ca2+–S100B that changed in position upon binding Zn2+. (c) Average RMSDs for the position of side-chain atoms when the Ca2+–S100B and Zn2+,Ca2+–S100B structures are compared. Those residues with average RMSD values greater than 1 are labeled on the bar graph.