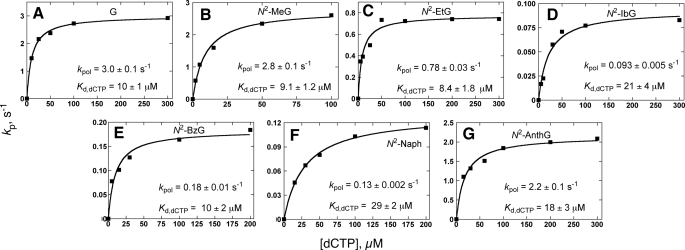
FIGURE 5.
Estimation of kpol and Kd,dCTP for Dpo4 by pre-steady-state burst rate dependence on dCTP concentration. Dpo4 (200 nm) was incubated with 100 nm 24-mer/36-mer primer·template complexes (32P-labeled) in a rapid quench-flow instrument and mixed with varying dCTP concentrations (2–300 μm) to initiate reactions. Plots of burst rates (kobs, fit by Equation 2) versus [dCTP] were fit to a hyperbolic equation (Equation 3). A, G (unmodified); B, N2-MeG; C, N2-EtG; D, N2-IbG; E, N2-BzG; F, N2-NaphG; and G, N2-AnthG. The calculated kpol and Kd values are shown in each panel of the figure.

