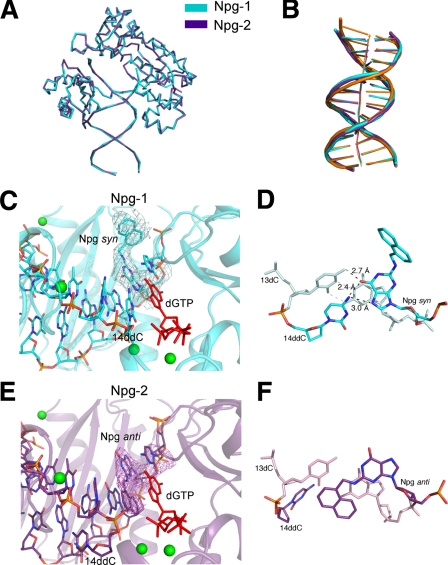
FIGURE 7.
Comparison of the Npg-1 and Npg-2 structures. A, superimposition of the refined Npg-1 (cyan) and Npg-2 (purple) structures reveals similar overall topology (r.m.s.d. 0.52). B, the DNA substrates from Npg-1 and Npg-2 were superimposed with the DNA from the ternary complex of Dpo4 inserting dCTP opposite 8-oxoG (orange, pdb ID code 2c2e). A more pronounced bending of the helical axis was observed in the N2-NaphG-modified DNA. Other perturbations in the N2-NaphG DNA, e.g. buckling of the bases and widening of the major groove near the primer·template junction, are also evident. C, the active site of the Npg-1 crystal structure is shown in schematic form. The 3Fo – 2Fc electron density map (cyan mesh) is contoured at the 1σ level around the N2-NaphG residue. The incoming dGTP (red) is shown along with the magnesium ions (green spheres). D, base pairing and stacking interactions observed in the Npg-1 structure. E, the active site of the Npg-1 crystal structure is shown in schematic form. The 3Fo – 2Fc electron density map (purple mesh) is contoured at the 1σ level around the N2-NaphG residue. The incoming dGTP (red) is shown along with the magnesium ions (green spheres). F, base pairing and stacking interactions observed in the Npg-2 structure.

