Figure 3.

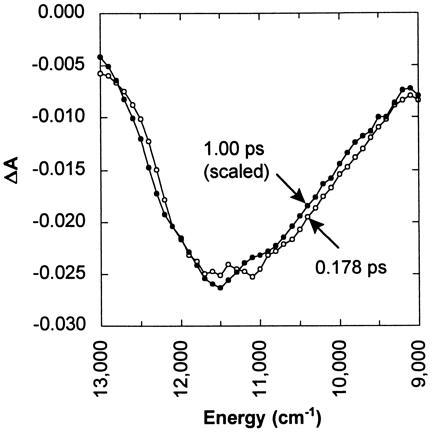
Comparison of stimulated emission spectra recorded at 178 fs (○) and 1.00 ps (•). The 1.00-ps spectrum has been scaled by a factor of 3.59. The similarity shows that the stimulated emission spectrum shifts negligibly beyond 178 fs.

Comparison of stimulated emission spectra recorded at 178 fs (○) and 1.00 ps (•). The 1.00-ps spectrum has been scaled by a factor of 3.59. The similarity shows that the stimulated emission spectrum shifts negligibly beyond 178 fs.