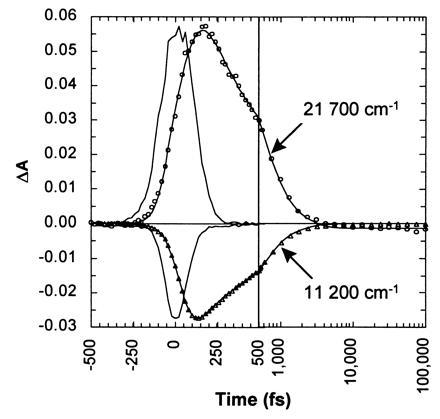
Figure 4.

Transient absorbance at the peak of the excited-state absorbance (21,700 cm−1; ○) and at the peak of the red-shifted stimulated emission (11,200 cm−1; ▵). The data were modeled (lines) by convoluting functions having both rise and fall times, i.e., ∝ [exp(−t/τfall) − exp(−t/τrise)], with the measured instrument response function. The instrument response function (Gaussian-like curve) was measured by an optical Kerr effect in a sample cell loaded with water.
