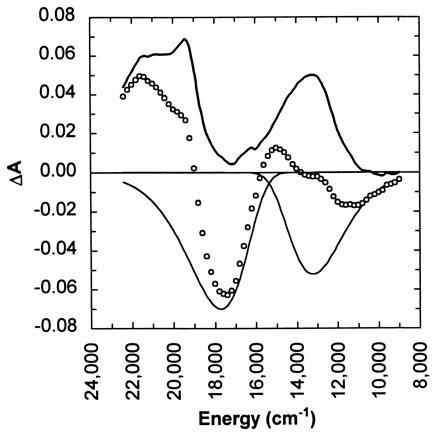
Figure 5.

Time-resolved absorbance spectrum measured 0.316 ps after photoexcitation with 620-nm pump pulses (○). The excited-state absorbance spectrum was constructed (thick line) by removing the bleaching and stimulated emission contributions (thin lines) to the measured time-resolved spectra. The pump and probe polarizations were set at the magic angle (54.7°) relative to one another.
