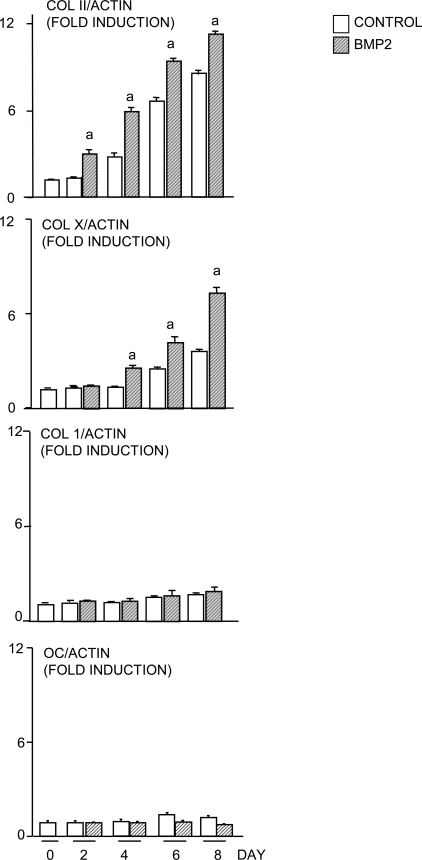
FIG. 4.
ATDC5 cells have characteristics of hypertrophic chondrocytes and not osteoblasts. ATDC5 cells were treated with BMP2 (100 ng/ml) for various times. The expression levels of Col II, Col X, Col 1, osteocalcin, and β-actin mRNA were determined by real-time RT-PCR. The relative expression levels of Col II, Col X, Col I, and osteocalcin were normalized by β-actin levels in the same sample. The fold induction level of individual genes was calculated as described in Fig. 1. a p < 0.05 vs. control value at same time-point.

