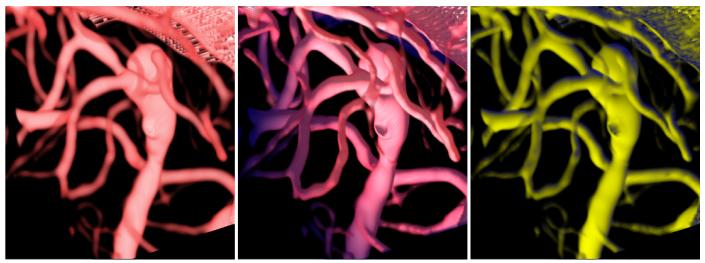
Fig. 12.
Visualizations of vessels around a brain aneurysm. The left image shows a standard volume rendering of the vessels. The clutter of vessels makes its hard to resolve which vessels are in front of which vessels. The middle image shows a vesselness enhanced visualization with distance color blending where the vessels that are farther away are colored in a shade of blue. The rightmost image is obtained by using tone shading. The shape and orientation of the vessels comes through, but depth information is not as clearly conveyed.

