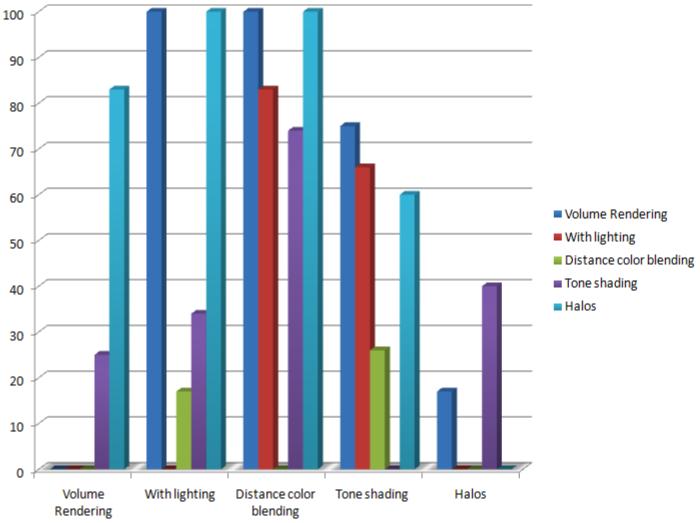
Fig. 13.

This graph shows the results of the user study. On the X-axis are all the techniques from the user study and on the Y-axis are the user preferences. For example, Volume rendering was preferred over tone shading 24.58% of the time, while subjects preferred plain volume rendering over halos 83.17% of the time. Notably, Distance color blending was preferred over all other techniques (as can be seen by the high preference numbers). Tone shading too was preferred over other techniques. Halos was least preferred over other techniques except in some cases over tone shading.
