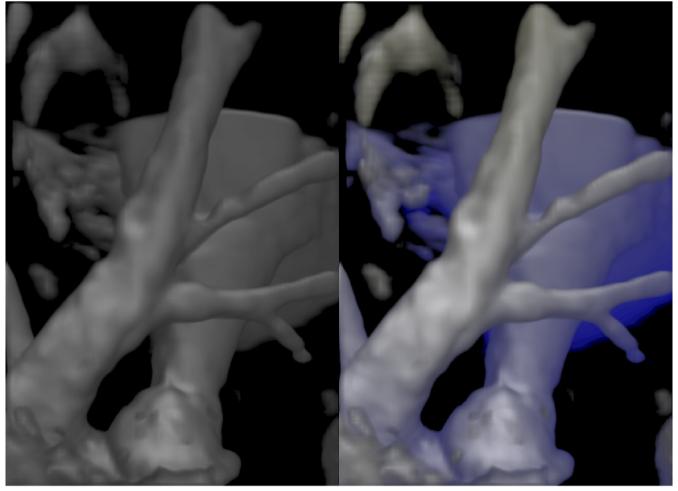
Fig. 7.

The left image shows a vesselness enhanced volume rendered visualization of the pulmonary artery of a lamb obtained from a MR angiography study. The right image shows a visualization with distance color blending conveying depth to the viewer. The parameters used for distance color blending are kds = 1.0,kde = 0.5,cb = (0,0,0.15).
