
Fig. 8.
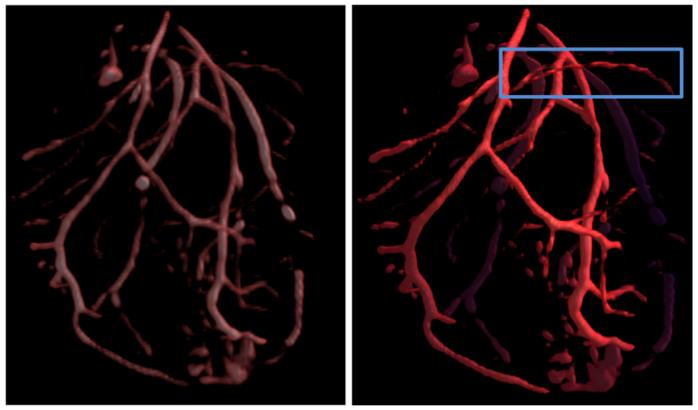
Visualization with volume rendering and distance color blending with enhanced vesselness. The right enhanced vesselness visualization shows thin vessels more clearly, particularly in the region marked by the blue rectangle. Distance color blending helps us understand that the vessel is closer to the viewer than farther away.