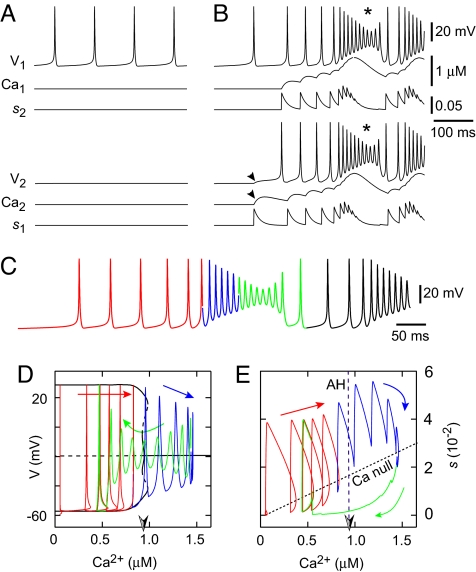
Fig. 1.
Group pacemaker models. (A and B) Uncoupled (A) and coupled (B) model neurons, showing voltage (V), Ca2+, and synaptic dynamics (s). Neuron 1 (N1, top) is initially tonic (A) and Neuron 2 (N2, bottom) is initially quiescent (A), before coupling (B). (C) Self-coupled single neuron with dynamics that resemble the 2-neuron case. Color coding applies to phase-plane analyses in D and E. (D) V-Ca2+ bifurcation diagram (black) with solution trajectory. Solid (dashed) black curves denote stable (unstable) structures, which are either nodes or the maximal and minimal voltages along families of periodic orbits. These include a curve of steady states at approximately −20 mV, which switches from unstable to stable in a supercritical Andronov-Hopf bifurcation (AH, half-shaded arrowhead; (Ca2+)AH in text) as Ca2+ increases, and 3 families of periodic orbits, a stable one that emerges from the AH bifurcation, an unstable family that emerges from the first, and a second stable family of larger amplitude (in maximal and minimal voltage) that emerges from the unstable periodic orbits. Red, blue, and green portions correspond to the voltage trace in C. Voltage spikes follow the large amplitude periodic orbits. Spike attenuation begins when Ca2+ becomes so large that this family of periodic orbits no longer exists. Because this occurs very close to (Ca2+)AH, we approximate the point where spike attenuation begins by (Ca2+)AH for simplicity (see text). (E) The s-Ca2+ phase plane showing the curve of AH points (the half-shaded arrowhead denotes (Ca2+)AH), and the Ca2+ nullcline (Ca null), with the solution trajectory in red, blue, and green.

