Fig. 3.
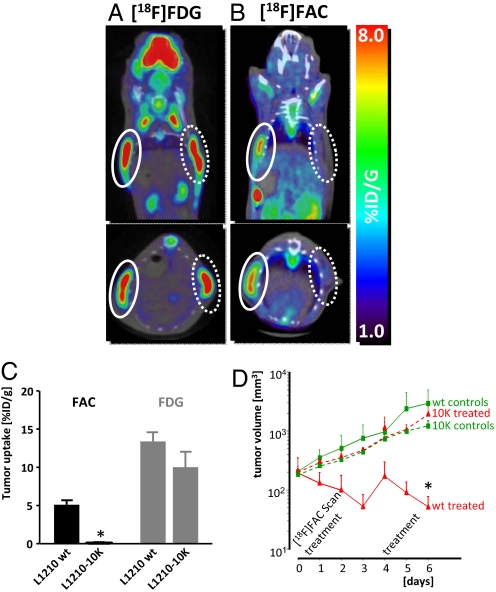
[18F]FAC microPET/CT distinguishes DCK-positive and -negative tumors in vivo and predicts responses to dFdC. (A) [18F]FDG microPET/CT scans of L1210 wt and L1210-10K tumors in SCID mice. Mice were imaged 1 h after i.p. injection of probe. Solid white circles denote L1210 wt tumors, dotted white circles denote L1210-10K tumors. (B) [18F]FAC microPET/CT scans of the same mice, imaged 1 day after the [18F]FDG microPET/CT scans. (C) Quantification of tracer uptake in tumors was performed by drawing regions of interest (2 mm3) at the tumor sites with Amide software. Data presented are from one experiment (n = 4 mice per group) that was repeated four times with reproducible results. (D) [18F]FAC microPET/CT can predict response to dFdC. SCID mice bearing either L1210 wt or L1210-10K tumors were paired for equal tumor size and randomized for treatment, receiving 360 mg/kg dFdC (on days 0 and 4) or no treatment (n = 3 per group). Caliper measurements were performed daily. Data are presented as tumor volumes over time (mm3).

