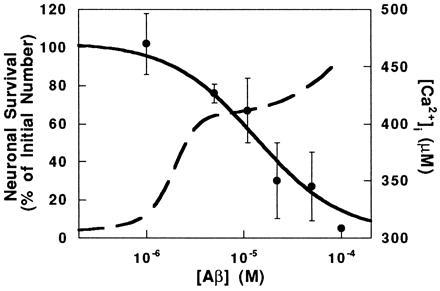
Figure 6.

Neuronal viability and Ca2+ response as a function of extracellular [Aβ]. Experimental data (•) of viability were taken from the literature (5–15). Error bars represent the SD of reported values at each [Aβ]. Simulations (broken line) were performed as in Fig. 5B. The left and right scales refer to the experimental data and simulation results, respectively.
