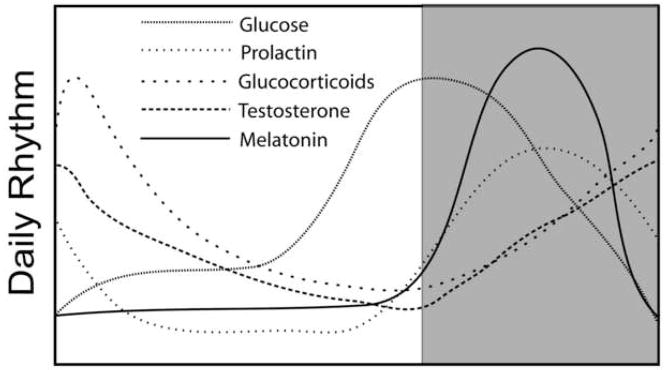
Figure 1.
Examples of circadian rhythms in humans. Shaded area represents times of sleep while the unshaded area represents times of activity. Note that all parameters exhibit unique peaks and troughs relative to each other. This phase relationship among individual rhythms is critical for optimal functioning and homeostasis.

