
Figure 2.
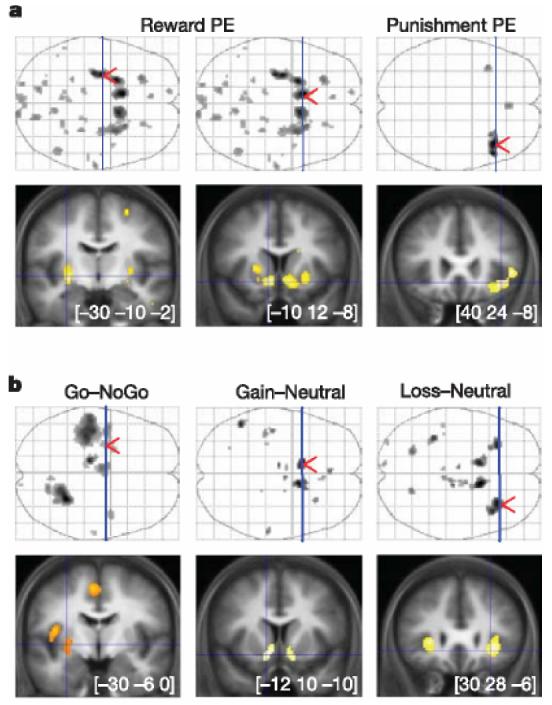
I Statistical parametric maps of prediction error and stimulus-related activity. Coronal slices (bottom) were taken at local maxima of interest indicated by red arrows on the axial projection planes (top). Areas shown in grey on axial planes and in orange or yellow on coronal slices showed significant effect after family-wise error correction for multiple comparisons (P , 0.05). a, Brain activity correlated with prediction errors derived from the computational model. Reward prediction errors (positive correlation) were found by conjunction of gain and loss conditions (left panels), whereas punishment prediction errors (negative correlation) were found in the loss condition alone (right panel). From left to right, MNI (Montreal Neurological Institute) coordinates are given for the maxima found in the left posterior putamen, left ventral striatum and right anterior insula. b, Statistical parametric maps resulting from main contrasts between stimuli conditions. Go and NoGo refer to stimuli position requiring, or not requiring, a button press to get the optimal outcome. Gain, neutral and loss correspond to the different pairs of stimuli. As above, the maxima shown are located in the left posterior putamen, left ventral striatum and right anterior insula, from left to right.