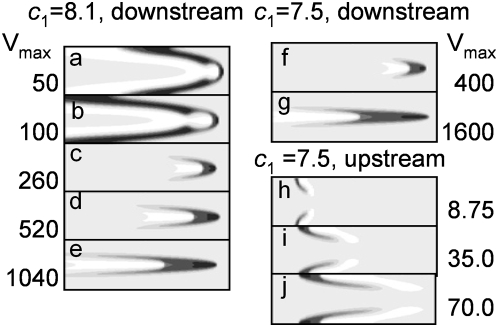
Figure 4. Effect of stream velocity on the evolution of (a–g) downstream waves and (h–j) upstream waves into restrictons, as calculated for (a–e)  (above-critical value for which plane waves exist in the absence of flow), and for (f–j)
  (subcritical value for which no plane waves exist in still medium).
Note that, for subcritical  , restrictons arise near the channel wall at low stream velocities (panels h–j). Activator
  (
( ) is shown on the same gray scale as in Fig. 1. In calculations,
  and
and  . The x and y axes are scaled differently: y axis is eightfold expanded relative to the x axis.

