
Figure 6. Restricton birth with increasing the stream velocity, as calculated for a  value close to a critical one (
 ): (a)
 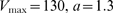 ; and (b)
 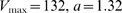 .
.

In calculations,  . Profiles of
  (thick lines) and
  (thin lines) on the channel axis for (c) a downstream wave and (d) restricton that emerges at close values of the parameters, as calculated for (a) and (b), correspondingly. The stream direction is from left to right.