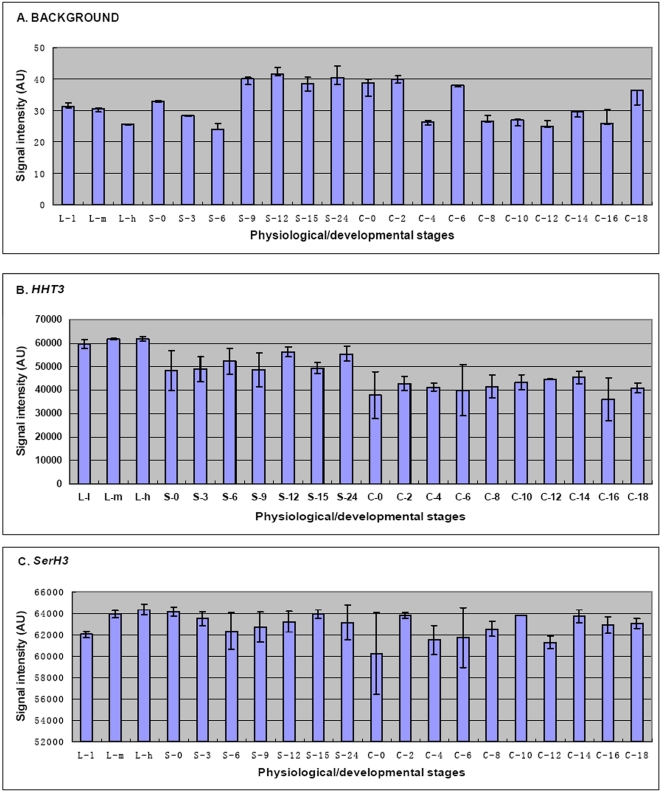
Figure 1. Background determination and normalization controls.
(A) Background signal intensities during growth (L-l to L-h), starvation (S-0 to S-24) and conjugation (C-0 to C-18) stages were determined using 4308 different random probes on each array. The signal intensities shown for these probes are the average of 12924 values for triplicate growth and starvation samples and 8616 values for duplicate conjugation samples. The bars represent the standard errors. (B, C) Relative levels of HHT3 and SerH3 mRNAs at all 20 stages. The results shown here are the average of triplicate growth and starvation samples and duplicate conjugation samples, and the bars represent the standard errors.

